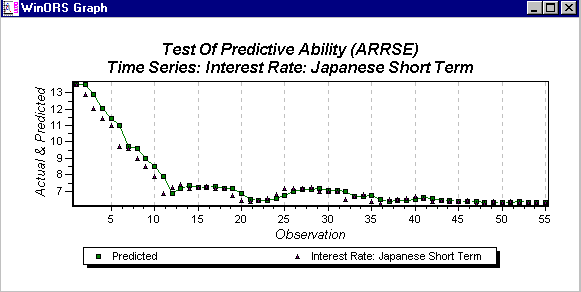
After
each execution of the forecasting method, the predicted and residual terms are
updated. This data, along with the
actual data, is immediately available for graphical analysis. Simply choose the Diagnostic Graph option. This option is located on the Chart menu,
Diagnostic branch (followed by the forecasting submenu).